"By almost any measure of societal breakdown that so-called Republican "values voters" decry, it is Red State America where moral failure is greatest."
While it's nice to be able to make categorical statements, the use of statistics is always subject to skepticism. The most notable exception to the "Blue States Good, Red States Bad!" dichotomy was the Great Plains region. Looking just at the healthcare and education data provided on that page, I noticed that the Great Plains outperformed most of the West Coast and New York on both counts. That makes it pretty obvious to me that there are additional dynamics occurring - largely related to demographics and economic conditions, I expect.
Another curiosity is the Iron Range in northern Minnesota. This area is rural and not in great shape economically, but was solidly blue, according to this map illustrating a county by county breakdown of voting results.

(This map from Wikipedia shows a more interesting distribution, using a gradient of color from red to blue to measure the outcome more precisely.)
California is particularly interesting. On the minimum wage map, California is one of very few states with minimum wages higher than the federal minimum proposed for 2009. They also have (arguably) one of the highest personal income tax rates in the nation (the 2nd highest, at the top of its range, according to this data; however, the bottom of the range is 1.0%, so ... whatever that implies). So why does it perform so poorly on measures of health care and educational statistics?
But now look at these maps from the US Census (keep in mind that Blue States are predominantly found in the Northeast/New England, the Great Lakes region, and the West Coast).
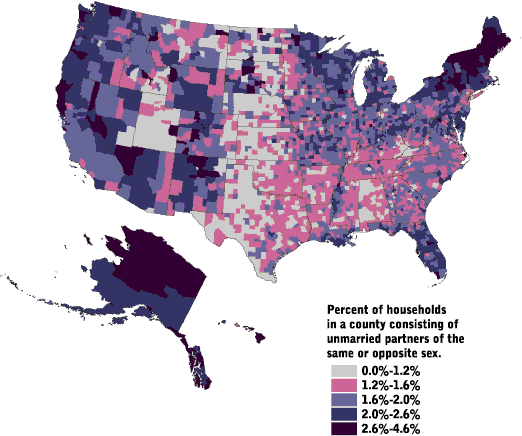
Unmarried Partners

It's pretty rough, and Alaska is an anomaly, but it looks like Blue areas have higher rates of households headed by couples (both straight and gay) who are not married.
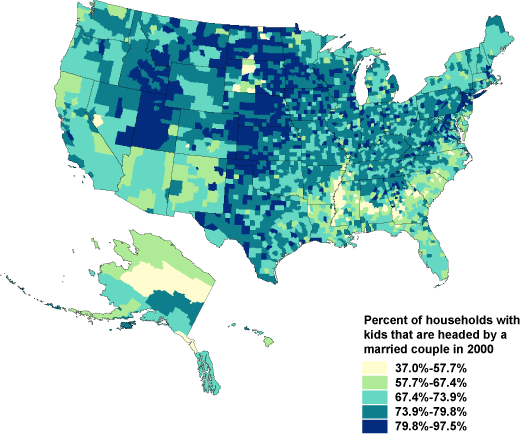
Nuclear Families

At the "opposite" side of the family composition spectrum, families with kids that are headed by a married couple are dominant throughout most of the country, but highest in the Great Plains (and Utah, but I wonder if it counts if the family is headed by one guy married to four women?). Looking a bit further, in those Red states with higher rates of this traditional family structure, educational performance appears to improve.
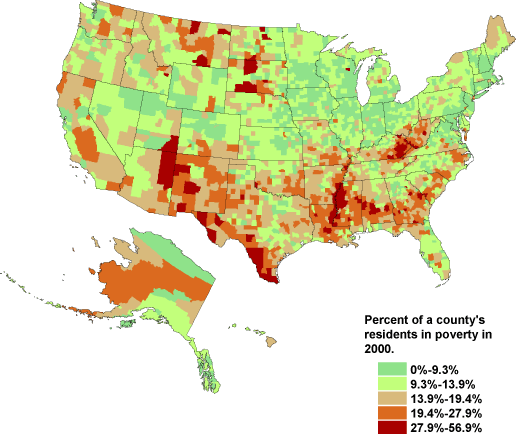
Now if we compare Nuclear Families to Poverty, an interesting trend appears:
 If you look closely at the two maps, there's a reasonably strong inverse correlation between poverty and percentage of families headed by a married couple. There's a curve of poverty in the South, along the Mississippi River and stretching east to the North Carolina Coast, that corresponds almost identically to a stretch of high levels of households lacking married leadership. Some counties in North and South Dakota show the same relationship.
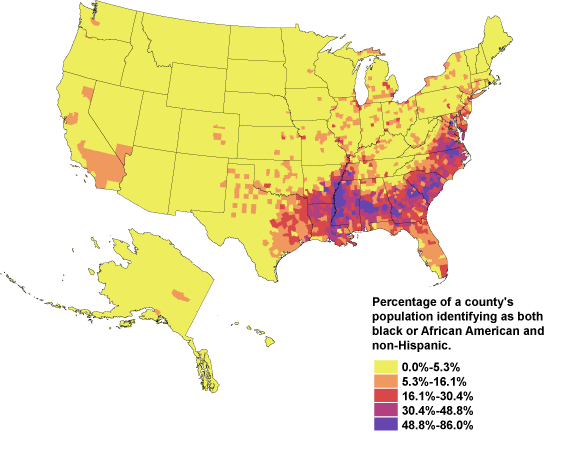
And now, look at this:
 This map shows, by county, the percentage of the population that identifies as black and non-Hispanic. Remember that swath of poor, single-parent families?
So what does all this mean? Does this mean that poor single-parent black families living in states with bad educational systems vote the same is non-poor white traditional nuclear families with better public education? Not really: among all that Red in the South, there's a familiar curve working its way through the area.
 But maybe if we throw religion into the mix, it will all become clear.
 Hmm... Those traditional families in the Great Plains are pretty religious, but the South looks only slightly more religious than the Northeast.
Well what the hell!? You mean I can't draw any solid conclusions that allow me to make categorical statements about how certain people vote!? But I can't live without stereotypes and the ability to divide people into "them" and "us" groups! I also can't live without exclamation points!


3 comments:
"Alaska is an anomaly?!" NO!
Sincerely,
65N 147W
'in this particular comparison,' I should have said.
No, you were right the first time. Trust me.
Post a Comment